WHM Plugin — Active Protection

Safety Monitor
Pro

WHM plugin for AI-powered server security monitoring.

Starting from
$5.00/mo
View Plans →
Instant Activation WHM Plugin 24/7 Monitoring Support 8 AM–8 PM GMT
Read-only first, safe by design
Safety Monitor watches and advises. It takes no destructive action on its own — every corrective step needs your explicit confirmation, and everything is logged.
WHM — Safety Monitor Pro › Live Dashboard
Protected
Safety Monitor Pro Live Dashboard
Real-time
Threat Monitoring
Read-only
Safe by Default
AI
Threat Analysis
cPanel/WHM
Native Integration
Protection Suite

Everything Your Server Needs

A complete WHM plugin that watches, detects, and reacts — so you don't have to.

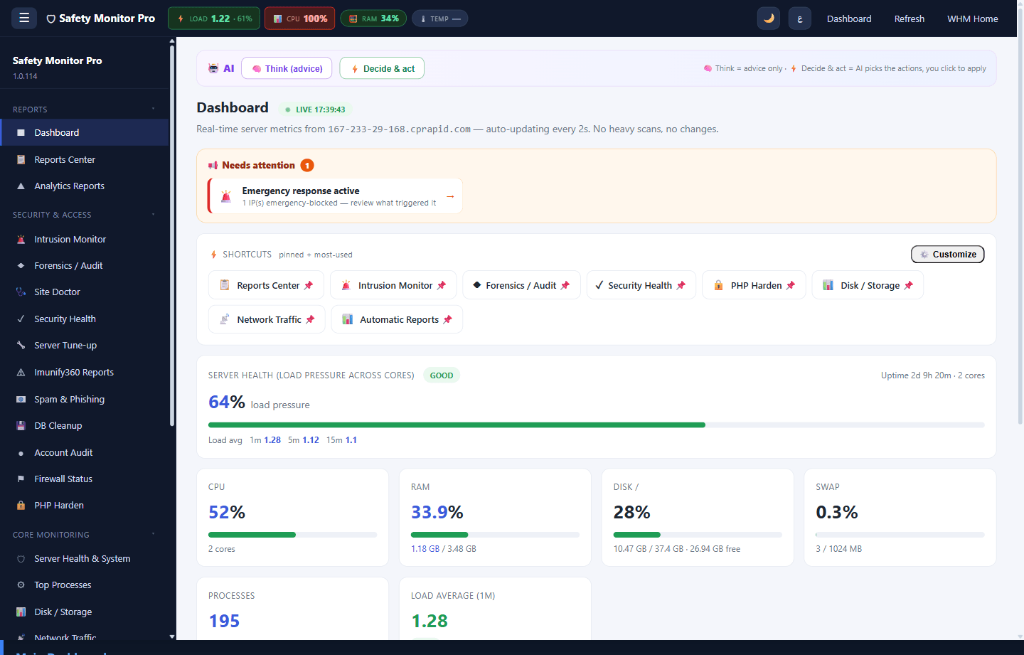
Live Dashboard
Real-time CPU, memory, load average and active alert feed — all in one view.
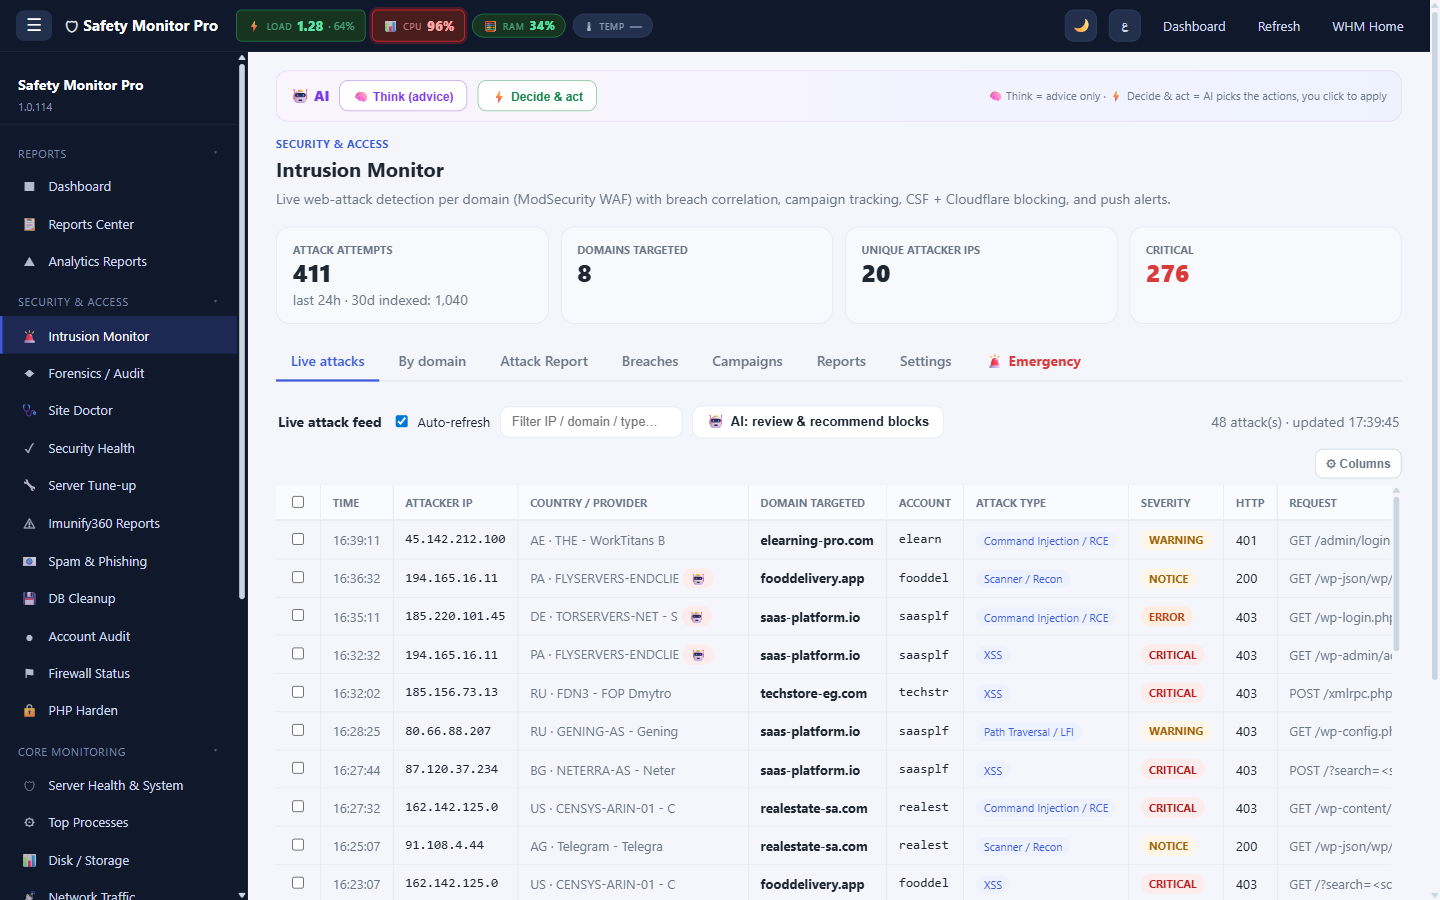
Intrusion Monitor
Per-domain web attack detection from ModSecurity audit log with live feed.
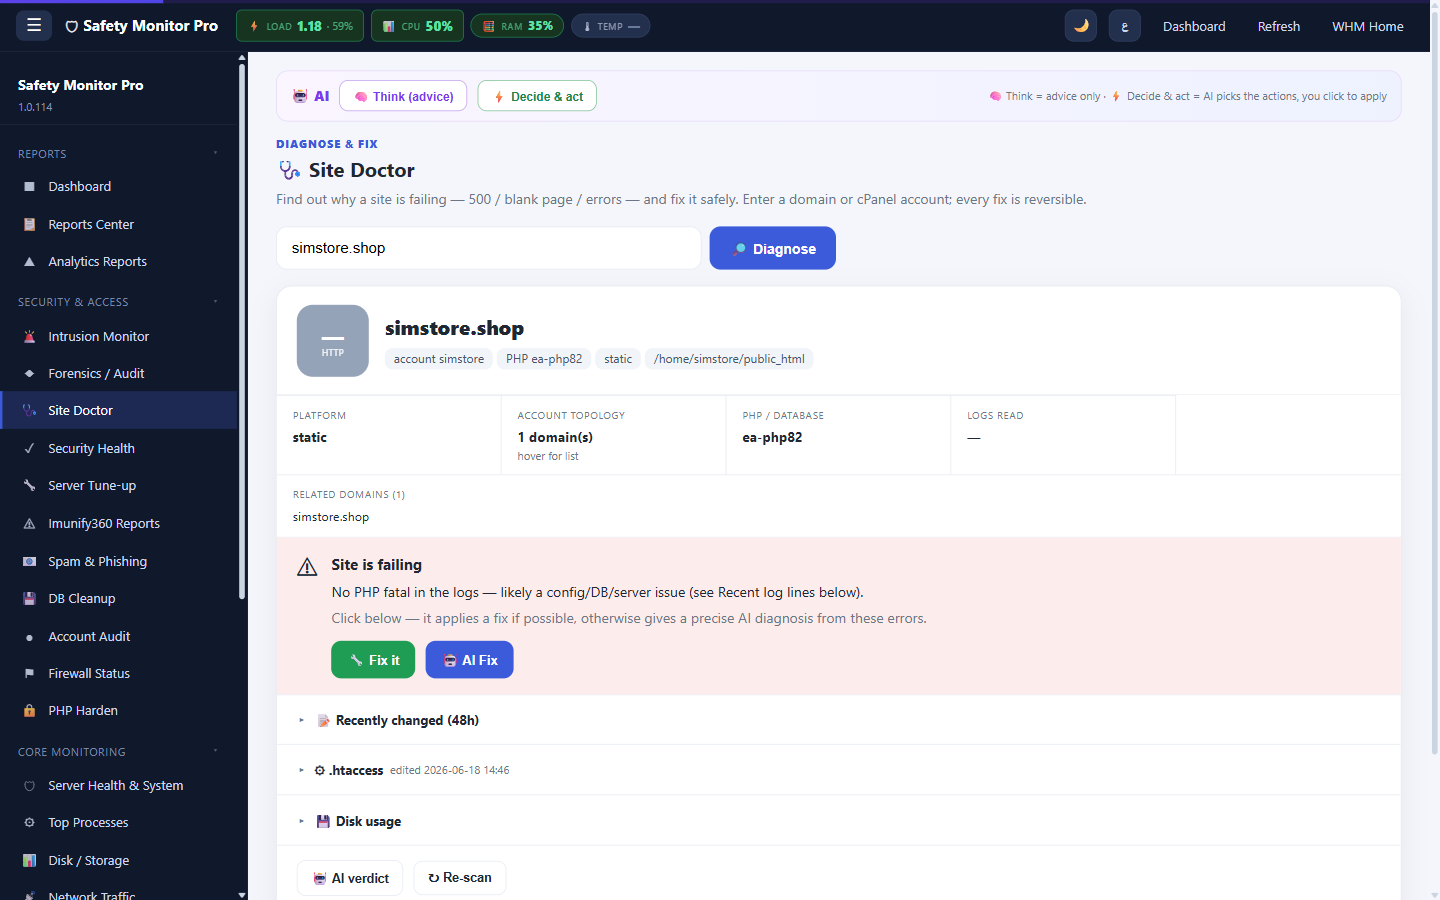
Site Doctor
Full security health-check per domain with auto-recommendations and fix hints.
Cooler Guard
Auto-throttle under CPU spike — never kills services, never suspends sites.
Country BlockGuard
Protect admin panels and specific paths by country with one click.
Smart Alerts
Instant WhatsApp + email on critical events with configurable thresholds.
Also included:
Real-time intrusion detection
Country block prevention
Load guard + Cooler mode
AI threat analysis
Per-domain monitoring
Real Screenshots

See It In Action

Actual plugin interface running on a live WHM server.
Live Dashboard — real-time server health & alerts
SM Pro Live Dashboard
Intrusion Monitor — per-domain attack feed
SM Pro Intrusion Monitor
Site Doctor — health check & recommendations
SM Pro Site Doctor
How It Works

4-Layer Protection Pipeline

01
Detect
ModSecurity audit log scanned continuously — every request, every domain, in real time.
02
Analyze
Attack patterns classified by type: SQLi, XSS, LFI, RCE and more — per domain.
03
Protect
Cooler Guard throttles runaway processes. Country BlockGuard locks admin paths.
04
Alert
Instant WhatsApp + email when a critical event is detected on your server.
No Automatic Destructive Actions

You Stay in Control

Safety Monitor never restarts services, kills PHP, or suspends accounts on its own. Every corrective action requires explicit admin confirmation, and every action is logged.

Never restarts services
It surfaces the issue — you decide.
Never kills PHP or suspends
Load Guard throttles gently; it never terminates site processes.
Every action is logged
A full audit trail of who did what, and when.
Interactive Demo

Try It Live & No Install Needed

This is a real-time simulation of the Safety Monitor Pro dashboard.

This is a read-only sandbox demo — “Apply Fix” buttons are illustrative and never execute real commands on a server.

⚠️ INTERACTIVE SANDBOX — Read-only demo environment. No real data, no real actions.
🛡️ Safety Monitor Pro v1.0.165
CPU 34%
RAM 78%
Disk 52%
--:--:--
SANDBOX DEMO
srv01.hostguard.host
167.233.29.168 · cPanel/WHM

📊 Dashboard

Server overview · srv01.hostguard.host
LIVE
⚠️ Needs Attention (2 items)
⚠️ CPU pressure elevated — navcoac and alicia each consuming >100% CPU  → View Top Processes
⚠️ 4,218 SSH brute-force attempts detected in the last 24 hours (3 active IPs)  → View Login Monitor
Server Health — load pressure across cores ELEVATED
21.8%
load pressure
Load avg: 1m 0.87 · 5m 0.62 · 15m 0.45
CPU Usage
34%
4 cores · elevated
RAM Usage
78%
6.2 GB / 8.0 GB
Disk /
52%
260 GB / 500 GB · 240 GB free
Swap
12%
614 MB / 5,120 MB
Processes
247
running tasks
Load Avg (1m)
0.87
21.8% of 4 cores

All Sections

Top Processes
2 DANGER
navcoac, alicia >100% CPU
🔐
Login Monitor
4,218 attacks
24h SSH brute force
🛡️
Security Health
2 issues
PHP hardening gaps
🔥
Firewall (CSF)
Active
2 IPs blocked today
📋
Auto Reports
Daily
last: 2h ago
💾
Backup Monitor
OK
last backup: 3h ago
🗄️
Database Cleanup
3 DBs
over 500 MB each
🌐
IP Forensics
Available
click to investigate
🔔
Notifications
Active
WhatsApp + Telegram
⚙️
Server Tuning
Optimal
no changes needed
🔑
Account Audit
12 accounts
all reviewed

⚡ Top Processes

Real-time CPU/MEM usage by user and process
LIVE
Load 1 / 5 / 15
0.87 / 0.62 / 0.45
system load average
Top User
navcoac
155% CPU  ·  8 processes
Active Users
12
cPanel accounts with processes
Processes Shown
247
total visible processes

Users by CPU

Click username to filter processes below
User Type Total CPU Pressure MEM Procs Top Command Risk Actions

Top Commands

Click command to filter below
Command Total CPU Process Count
php 591% 38 procs
httpd 48% 22 procs
node 15% 8 procs
mysqld 3% 3 procs
sshd 1% 4 procs
python 0.5% 2 procs

Raw Processes

Showing all 247 processes
User PID PPID Process CPU% MEM% STAT ETIME Args

🔐 Login Monitor

SSH access tracking · brute-force detection
LIVE
Failed Attempts (24h)
4,218
SSH authentication failures
Brute-force Candidates
3 IPs
>50 attempts per IP
Successful Logins
7
last 24 hours
CSF Blocks Today
2
auto-blocked by smpro

SSH Hardening Checks

⚠️
PasswordAuthentication
yes
Should be: no (use keys only)
PermitRootLogin
no
Root login is disabled
⚠️
Port
22
Default port exposed to internet
⚠️
MaxAuthTries
6
Should be ≤3

Brute-force Candidates

IP Address Country Attempts First Seen Last Seen CSF Status Actions
185.234.219.44 🇷🇺 RU 2,847 2h ago 12m ago not blocked
103.41.204.12 🇨🇳 CN 891 5h ago 34m ago CSF blocked
45.152.66.198 🇳🇱 NL 480 11h ago 2h ago not blocked

🔒 Block/Allow actions are disabled in this sandbox demo environment.

Recent Successful Logins

User Source IP Auth Method When
root 167.233.29.168 server publickey 14 min ago
root 192.168.1.5 local publickey 2h ago
admin 185.x.x.x password 6h ago
deploy 10.0.0.1 local publickey 9h ago
root 167.233.29.168 server publickey 14h ago
admin 91.108.4.x publickey 20h ago
root 167.233.29.168 server publickey 23h ago
📂
FTP Login tracking active
No FTP login events in the last 24 hours

cPHulk Events (Last 24h)

IPUsernameAttemptsStatusWhen
185.234.219.44root2,847blocked2h ago
103.41.204.12admin891blocked5h ago
45.152.66.198root480monitoring11h ago
77.83.143.22root44expired18h ago

🛡️ Security Health

Comprehensive server security audit
LIVE
Overall Security Score
73/100
3 checks need attention
050100
7
Passed
3
Warnings
0
Critical
CSF Firewall
Active · STATEFUL mode
Ports 22, 80, 443 exposed
SSH Root Login
PermitRootLogin = no
Root login is disabled
⚠️
SSH PasswordAuth
PasswordAuthentication = yes
Should be disabled; use keys only
⚠️
PHP open_basedir
3 cPanel accounts not hardened
navcoac, alicia, alyousefeng
SSL Certificates
All certificates valid
12 domains covered
Disk Space
52% used — healthy
240 GB free on /
Backups
Backup running normally
Last backup completed 3h ago
⚠️
PHP disable_functions
2 accounts missing key functions
exec, shell_exec not disabled
ModSecurity
Active and enforcing
847 rules loaded
cPHulk
Active and protecting
15 IPs currently blocked

Recommended Actions

⚠️
Disable SSH Password Authentication
Edit /etc/ssh/sshd_config — set PasswordAuthentication no, then restart sshd. This eliminates brute-force SSH password attacks entirely.
⚠️
Harden PHP open_basedir for 3 accounts
Accounts navcoac, alicia, alyousefeng are missing open_basedir restriction. This allows PHP scripts to access files outside their home directory.
⚠️
Add missing PHP disable_functions
2 accounts are missing critical PHP function restrictions. exec, system, shell_exec, passthru should be disabled for shared hosting accounts.

🔥 Firewall Status

ConfigServer Security & Firewall (CSF)
LIVE
CSF Status
✅ ACTIVE
Mode: STATEFUL  ·  Testing: OFF
12
Open ports
0
Temp blocks
2
Perm blocks
1
Allow list

Permanently Blocked IPs

IP Address Country Attempts Reason Actions
103.41.204.12 🇨🇳 CN 891 smpro Login&Access 2026-06-20
198.51.100.44 🇺🇸 US 127 manual block

Allow List (csf.allow)

IP Address Label Note Actions
167.233.29.168 server IP always allow

Open TCP Ports (TCP_IN)

2021 2225 2653 80110 143443 465587 993995 22222083 2087

CSF Activity (24h)

Connection attempts blocked 12,481
Port scan detections 3
LF_SSHD triggers 47
Rules reloaded 2
Safety Monitor Pro v1.0.165  ·  Read-only guarantee  ·  All actions are disabled in this demo  ·  © HostGuard
Pricing

Choose Your Plan

Four tiers, one plugin. All include instant activation and fast business-hours support.

Basic
$5.00 /mo
1 server included
  • Real-time ModSecurity attack monitor
  • Login & brute-force visibility
  • Per-domain attack reports
Get Basic
Standard
$12.00 /mo
1 server included
  • Everything in Basic
  • CSF / LFD firewall integration
  • Load Guard — never kills sites
  • Country BlockGuard (GeoIP)
  • Security Health / Site Doctor
Get Standard
★ Most Popular
Pro
$22.00 /mo
1 server included
  • Everything in Standard
  • AI Threat Analysis
  • Protection Profiles (Medium/Max/AI)
  • Auto-block repeat attackers
  • WhatsApp & email alerts
Get Pro
Ultra
$45.00 /mo
Up to 5 servers
  • Everything in Pro
  • Central multi-server Hub
  • Priority support (business hours)
Get Ultra
Compare Plans

Every Feature, Side by Side

See exactly what each tier includes before you commit.

Feature
Basic
$5.00 /mo
Standard
$12.00 /mo
★ POPULAR
Pro
$22.00 /mo
Ultra
$45.00 /mo
Real-time ModSecurity attack monitor
Login & brute-force visibility
Per-domain attack reports
CSF / LFD firewall integration
Load Guard (never kills sites)
Country BlockGuard (GeoIP)
Security Health / Site Doctor
AI Threat Analysis
Protection Profiles (Medium/Max/AI)
Auto-block repeat attackers
IP reports & audit trail
WhatsApp & email alerts
Central multi-server Hub
Servers included Up to 5
Support (business hours) Standard Standard Priority Priority
Get Basic Get Standard Get Pro Get Ultra
Questions? Contact us — we reply during business hours (8 AM – 8 PM GMT).
Technical FAQ

Questions Engineers Ask

Straight answers on performance, compatibility, licensing, and what the plugin does — and doesn’t — do.

What is the performance and resource impact on my server?
Minimal. Safety Monitor is event-driven and log-driven, not a resident polling daemon — it does not hold a persistent process. Dashboard metrics are read on page load, and background work is limited to short, throttled cron tasks (incremental log parsing and a periodic GeoIP refresh). Log parsing is bounded and reads new lines incrementally, so it does not re-scan large audit logs from scratch. On a typical WHM server the steady-state overhead is negligible.
Does it conflict with CSF / LFD?
No — it is complementary, not a replacement. Safety Monitor reads your existing CSF/LFD state and, only when you confirm an action, can add allow or deny rules through CSF. It does not run its own competing firewall and does not fight LFD over the same rules. On first entry it offers to allowlist your current admin IP so a firewall rule can never lock you out of your own server.
Can it run alongside Imunify360 or CloudLinux?
Yes. It runs alongside Imunify360, CloudLinux, and similar suites — it reads shared signals such as the ModSecurity audit log and focuses on visibility plus load safety, so it does not compete for the same enforcement layer. To be clear: we are not affiliated with, partnered with, or certified by CloudLinux, Imunify360, or LiteSpeed — “runs alongside” simply means it coexists without conflict.
Does it require root / WHM access?
Yes. It installs as a native WHM plugin via AppConfig and runs at the WHM (root) level, because reading server-wide logs, load metrics, and firewall state requires that access. It is a server administrator (WHM) tool, not a per-cPanel-account add-on.
What logs and data sources does it read?
The signals your server already produces: the ModSecurity audit log (for intrusion detection), CSF/LFD state, cPanel/Apache access logs, and system load metrics from /proc. It also uses a self-contained GeoIP country/ASN database for Country BlockGuard, which requires no external API key. It reads these sources — it does not modify them.
Does it make automatic changes to my server?
No. It is read-only first and safe by design. It monitors, classifies, and recommends, but it never restarts services, kills PHP, or suspends accounts on its own. Load Guard (Cooler) throttles gently under CPU spikes and never terminates site processes. Every corrective action requires your explicit confirmation, and every action is logged.
How does the AI threat analysis work?
It classifies suspicious activity by pattern — grouping ModSecurity events into attack types (SQLi, XSS, LFI, RCE and similar), flagging brute-force and repeat offenders, and scoring per-domain risk. The output is read-only, safe-by-default recommendations and prioritized alerts, not automatic enforcement. You review the analysis and decide what, if anything, to act on.
What are the OS and cPanel/WHM version requirements?
A server running cPanel & WHM on a supported Linux distribution (for example AlmaLinux, Rocky Linux, or CloudLinux) on a VPS or dedicated server, with PHP available in WHM. It is designed for current, supported cPanel/WHM releases. If you are on a supported cPanel version, it installs as a standard WHM plugin.
How is the license delivered and activated?
Instantly. On successful payment your plugin license is issued and your plugin download appears immediately in your customer portal — there is no manual waiting step. You then run the WHM installer and activate the license inside the plugin.
Can the license move to a new IP or server, and does any monitoring data leave my server?
Yes to the move, no to the data. Licenses are keyed to your server IP and are transferable when you migrate to a new IP or server. And no monitoring data leaves your server for analysis — there is no external agent or off-box telemetry collecting your logs; the dashboard, parsing, and AI classification all run locally within your WHM.
More technical detail in our documentation & technical specs.
Ready to Protect Your Server?

Start Monitoring in Under a Minute

Install the WHM plugin, activate your license, and get real-time protection immediately.

Have questions about Safety Monitor Pro? Use the chat on this page.

Support 8 AM–8 PM GMT · urgent messages accepted anytime

Questions? Use the chat on this page and our team will help you.

Support 8 AM–8 PM GMT · urgent messages accepted anytime

Chat with us →